
Why the numbers behind your food depend on where you live
6 min read
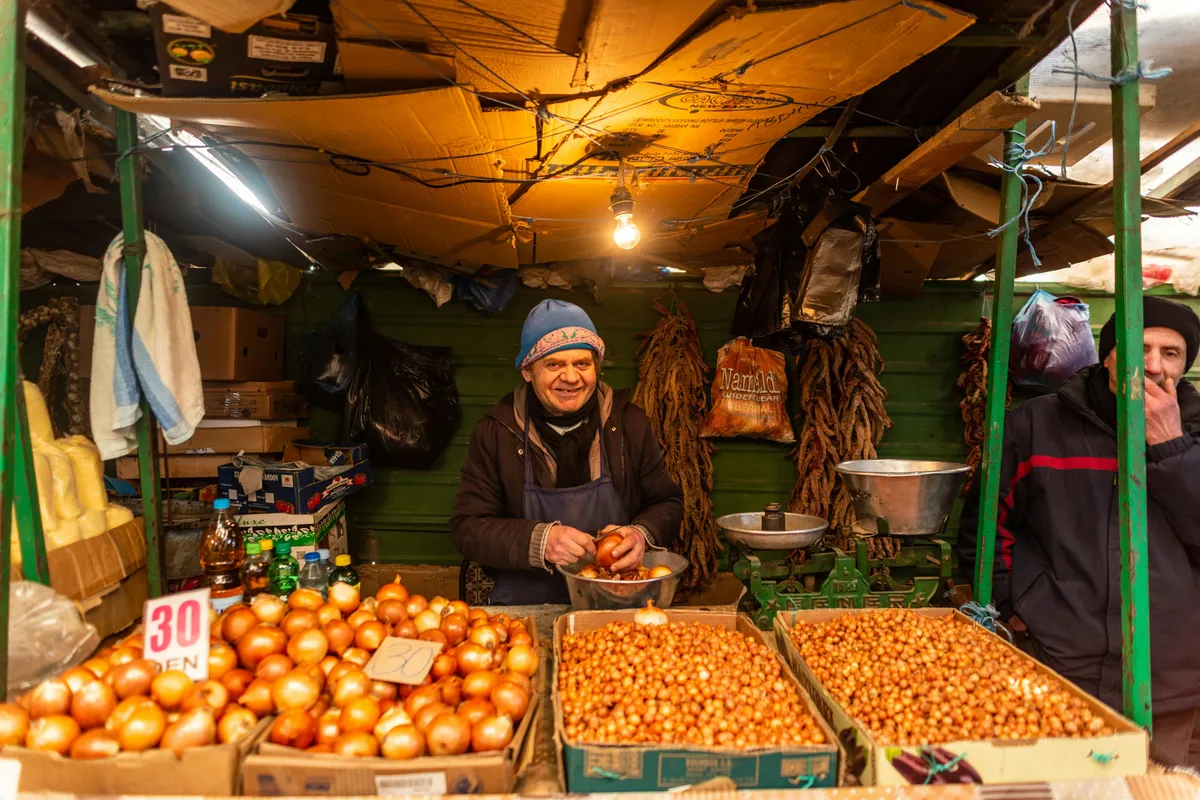
Type "bread" into a calorie tracker and you will get a number. What you will not get is any hint of whose bread it is. A dense rye loaf from a northern bakery and a soft white sandwich loaf from an American supermarket are both bread, and slice for slice they are not the same food. Every calorie figure you have ever logged came out of a table that somebody compiled, in some country, from the food that was on sale there.
Most people never think about that table. It is worth five minutes, because it quietly decides how well your log matches what is actually on your plate.
Where the numbers come from
Nobody calculates the calories in a carrot from first principles. Somebody buys carrots, a lot of them, from the shops and markets of one country, takes them to a laboratory and measures what is in them. The results go into that country's food composition table: a long, unglamorous public document listing what a hundred grams of each common food contains. A national institute usually keeps it, and an international network under the United Nations' food agency helps the institutes agree on methods.
For fresh and generic foods, those reference figures are what sits underneath a tracker's search results. For packaged products the number usually comes off the manufacturer's label instead. Either way, the figure has a home country, and it describes the food as it exists there.
Why the same word means different food
- The product itself is different. Take minced beef. Lean mince is about 135 calories per hundred grams raw. Regular mince, with four times the fat, is about 250. Which of the two a shop simply calls "mince", and which one a table lists first, depends on what that country usually sells.
- The unit is different. Gram for gram, rye bread and soft white bread are nearly the same, around 260 calories per hundred grams. But a slice of dense rye weighs 40 or 50 grams and a slice of white sandwich bread about 25. "One slice of bread" is well over a hundred calories in one country and about 65 in another.
- The recipe is different. Sausage, yoghurt, cheese, a croissant: everyday foods are made to local habits, and a table records the local version. The entry called "natural yoghurt" may be made with whole milk in one table and skimmed milk in the next.
- The rules are different. Some countries require flour to be enriched with vitamins and minerals and others do not, so the same slice of white bread carries different micronutrients depending on which side of a border it was baked.
Even the label is not universal
The differences reach the packaging. In the European Union a nutrition label has to state its values per hundred grams or millilitres, which makes any two packets directly comparable. In the United States the label is built around a serving the manufacturer declares, so the first step in reading it is checking how many servings you are holding.
The lines themselves are defined differently too. On an American label, fibre is counted inside the carbohydrate figure. On a European label it is listed apart from it, and given a lower energy value per gram than other carbohydrate. Take a cereal with 60 grams of starch and sugar and 10 grams of fibre in every hundred. The American label says "Total carbohydrate 70 g". The European one says "Carbohydrate 60 g" and gives the fibre a line of its own. Same cereal, and both labels are correct. Salt is declared as salt on one side of the Atlantic and as sodium on the other.
None of this is anybody being careless. When researchers compared the national tables of several European countries for a large diet study, they found most nutrients were measured and expressed compatibly, but that some, including energy, carbohydrate and fibre, were defined differently enough that the values could not be compared without reworking them first.
What it does to a food log
Any one of these differences is small. What makes them matter is that they do not average out. If your tracker's "mince" is the lean kind and your butcher's is not, you are short by the same hundred-odd calories every time you log it. If its slice of bread is half the weight of yours, every sandwich is short by the same amount. An error that is random washes out over a month. An error that is wrong the same way every day does not. It moves your whole log up or down, and every decision you take from the log moves with it.
The other cost is time. Search a database built for another country for the cheese in your fridge, and the list is full of brands you have never seen in a shop. You scroll, give up, and pick the closest-sounding one, which is exactly how the first problem gets in.
What you can do about it
- Trust the packet in your hand. For anything with a label, the label on your own product beats a generic entry from anywhere. A barcode gets you that product rather than a namesake.
- Check the unit before the number. Per hundred grams or per serving, per slice or per gram, raw or cooked: reading one as the other is the commonest way to be out by half, or by double, without noticing.
- Prefer local entries for fresh food. If a search result is obviously from another market, the brand gives it away. Scroll past it.
- Check your staples once. The ten or so foods you log every week are most of your log. Hold each entry against the pack, or against your own country's table, one time. Then reuse the entry you checked.
A food log is only ever as local as the data under it. It is worth knowing which country yours was built in.
Sources
- USDA FoodData Central - the reference values behind the mince and bread figures. fdc.nal.usda.gov
- FAO, the International Network of Food Data Systems (INFOODS) - how national food composition data is compiled and standardised. fao.org/infoods
- Regulation (EU) No 1169/2011 on the provision of food information to consumers - values per 100 g or 100 ml, and the energy conversion factors. eur-lex.europa.eu/eli/reg/2011/1169/oj
- US Food and Drug Administration, "Serving Size on the Nutrition Facts Label". fda.gov/food/nutrition-facts-label
- Deharveng G et al., a comparison of the nutrients in the national food composition tables used by a European diet and cancer study (EPIC), European Journal of Clinical Nutrition, 1999. pubmed.ncbi.nlm.nih.gov/10048800
New posts by email
One email when a new post lands. Nothing else, and an unsubscribe link in every one.
Prefer a feed reader? RSS feed →